The heights (in cm) for a random sample of 60 males were measured.The sample mean is 166.55,the standard deviation is 12.57,the sample kurtosis is 0.12,and the sample skewness is −0.23.The following table shows the heights subdivided into non-overlapping intervals. 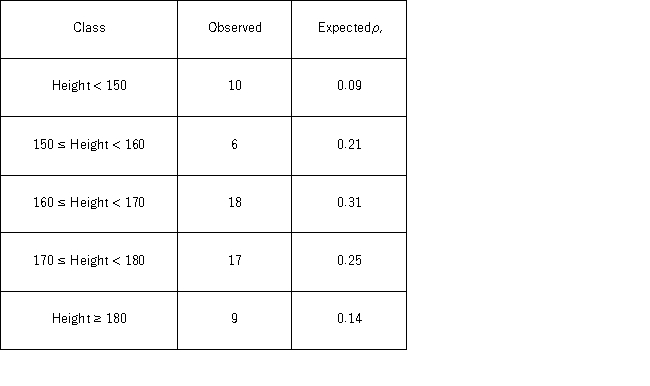 For the goodness-of-fit test for normality,the null and alternative hypothesis are ______________________________________________________________________.
A) H0: Heights follow a normal distribution with mean 166.55 and standard deviation 12.46,HA: Heights do not follow a normal distribution with mean 166.55 and standard deviation 12.46
B) H0: Heights do not follow a normal distribution with mean 166.55 and standard deviation 12.46,HA: Heights follow a normal distribution with mean 166.55 and standard deviation 12.46
C) H0: Heights follow a normal distribution with mean 166.55 and standard deviation 12.57,HA: Heights do not follow a normal distribution with mean 166.55 and standard deviation 12.57
D) H0: Heights do not follow a normal distribution with mean 166.55 and standard deviation 12.57,HA: Heights follow a normal distribution with mean 166.55 and standard deviation 12.57
Correct Answer:
Verified
Q72: The following table shows the distribution of
Q73: The heights (in cm)for a random sample
Q74: The following table shows the distribution of
Q75: In the following table,individuals are cross-classified by
Q76: The following table shows the distribution of
Q78: The following table shows the distribution of
Q79: In the following table,individuals are cross-classified by
Q80: In the following table,individuals are cross-classified by
Q81: The airline industry defines "no-shows" as passengers
Q82: The airline industry defines "no-shows" as passengers
Unlock this Answer For Free Now!
View this answer and more for free by performing one of the following actions

Scan the QR code to install the App and get 2 free unlocks

Unlock quizzes for free by uploading documents