The airline industry defines "no-shows" as passengers who have purchased a ticket but fail to arrive at the gate on time for departure.United Airlines operates many flights from Philadelphia to Dallas.The table below represents the observed number of no-shows that occurred on a random sample of 120 flights between Philadelphia and Dallas this year,and experienced the no-show proportions last year. 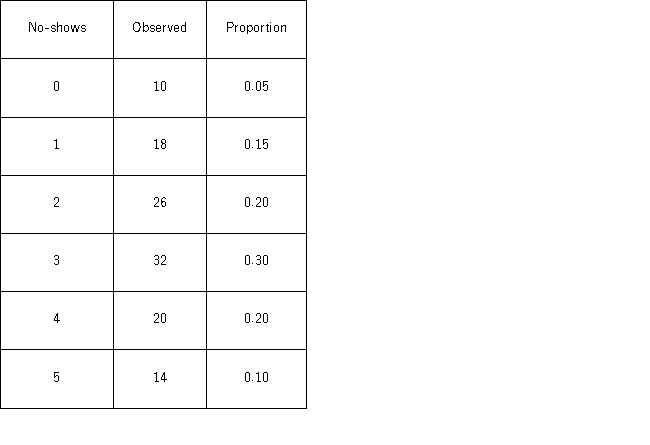 United Airlines would like to know if the proportions of no-shows has changed between last year and this year on flights between these two cities using α = 0.05.The critical value for this hypothesis is ______.
A) 5.991
B) 7.815
C) 9.448
D) 11.070
Correct Answer:
Verified
Q76: The following table shows the distribution of
Q77: The heights (in cm)for a random sample
Q78: The following table shows the distribution of
Q79: In the following table,individuals are cross-classified by
Q80: In the following table,individuals are cross-classified by
Q82: The airline industry defines "no-shows" as passengers
Q83: The heights (in cm)for a random sample
Q84: A manufacturer of flash drives for data
Q85: The heights (in cm)for a random sample
Q86: The heights (in cm)for a random sample
Unlock this Answer For Free Now!
View this answer and more for free by performing one of the following actions

Scan the QR code to install the App and get 2 free unlocks

Unlock quizzes for free by uploading documents