The heights (in cm) for a random sample of 60 males were measured.The sample mean is 166.55,the standard deviation is 12.57,the sample kurtosis is 0.12,and the sample skewness is −0.23.The following table shows the heights subdivided into non-overlapping intervals. 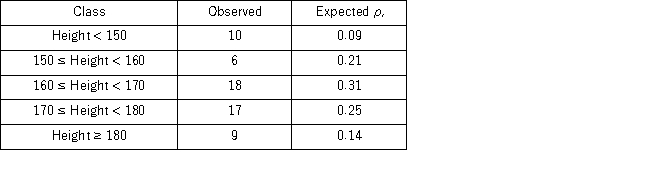 Using the p-value approach and α = 0.05,the decision and conclusion are ___________________________________________________________________.
A) reject the null hypothesis;conclude that heights are normally distributed
B) reject the null hypothesis;conclude that heights are not normally distributed
C) do not reject the null hypothesis;conclude that heights are normally distributed
D) do not reject the null hypothesis;conclude that heights are not normally distributed
Correct Answer:
Verified
Q80: In the following table,individuals are cross-classified by
Q81: The airline industry defines "no-shows" as passengers
Q82: The airline industry defines "no-shows" as passengers
Q82: The heights (in cm) for a random
Q83: The heights (in cm)for a random sample
Q84: A manufacturer of flash drives for data
Q86: The heights (in cm)for a random sample
Q88: The heights (in cm)for a random sample
Q89: The heights (in cm)for a random sample
Q90: Suppose Bank of America would like to
Unlock this Answer For Free Now!
View this answer and more for free by performing one of the following actions

Scan the QR code to install the App and get 2 free unlocks

Unlock quizzes for free by uploading documents