The following table shows numerical summaries of the worst quarter returns (in percentages)for a sample of 121 hedge funds. 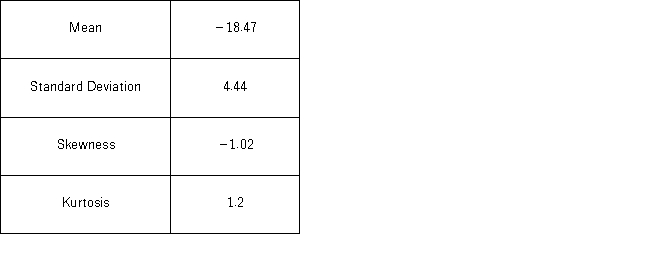 a.Set up the competing hypotheses for the Jarque-Bera test for normality for the worst quarter returns.
b.Calculate the value of the test statistic and find thep-value.
c.Does the evidence suggest the worst quarter returns do not have a normal distribution at the 5% significance level?
Correct Answer:
Verified
View Answer
Unlock this answer now
Get Access to more Verified Answers free of charge
Q110: The following table shows the cross-classification of
Q111: A researcher wants to verify his belief
Q112: The following table shows the observed frequencies
Q113: The following table shows the observed frequencies
Q115: The following table shows the cross-classification of
Q115: MARS claims that Skittles candies should be
Q116: The following frequency distribution shows the monthly
Q117: The following frequency distribution shows the monthly
Q119: Suppose Bank of America would like to
Q120: The following frequency distribution shows the monthly
Unlock this Answer For Free Now!
View this answer and more for free by performing one of the following actions

Scan the QR code to install the App and get 2 free unlocks

Unlock quizzes for free by uploading documents