The following frequency distribution represents the number of hours studied per week by a sample of 50 students. 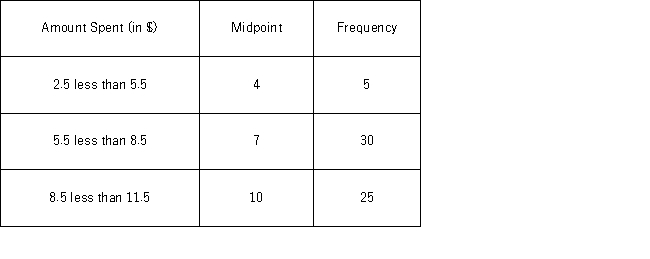 The mean number of hours studied is ____.
A) 7
B) 8
C) 22.8
D) 480
Correct Answer:
Verified
Q103: The mean grade of the 30 students
Q106: What does the covariance measure?
A) The direction
Q109: An investor bought common stock of Blackstone
Q112: The following data represents the actual talk
Q113: What is an advantage of the correlation
Q113: The following frequency distribution represents the number
Q115: The following data represent the wait time,in
Q116: The _ identifies the number of standard
Q116: Automobiles traveling on a road with a
Q130: Suppose the wait to pass through immigration
Unlock this Answer For Free Now!
View this answer and more for free by performing one of the following actions

Scan the QR code to install the App and get 2 free unlocks

Unlock quizzes for free by uploading documents