Automobiles traveling on a road with a posted speed limit of 65 miles per hour are checked for speed by a state police radar system.The following is a frequency distribution of speeds.The following frequency distribution represents the number of hours studied per week by a sample of 50 students. 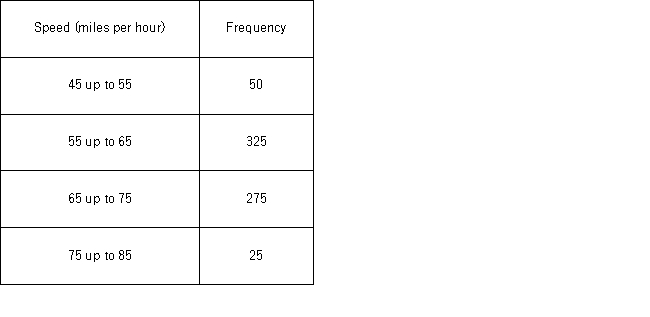 The mean speed of the automobiles traveling on this road is the closest to ____.
A) 55.0
B) 57.8
C) 64.1
D) 65.0
Correct Answer:
Verified
Q106: What does the covariance measure?
A) The direction
Q107: When interpreting the covariance between variables x
Q108: Which of the following is not true
Q111: The following frequency distribution represents the number
Q112: The following data represents the actual talk
Q112: The covariance between the returns on two
Q113: The following frequency distribution represents the number
Q115: The following data represent the wait time,in
Q120: The daily high temperature in Philadelphia over
Q121: The following sample data shows the starting
Unlock this Answer For Free Now!
View this answer and more for free by performing one of the following actions

Scan the QR code to install the App and get 2 free unlocks

Unlock quizzes for free by uploading documents