A city in California spent $6 million repairing damage to its public buildings in 2010.The following table shows the categories where the money was directed. 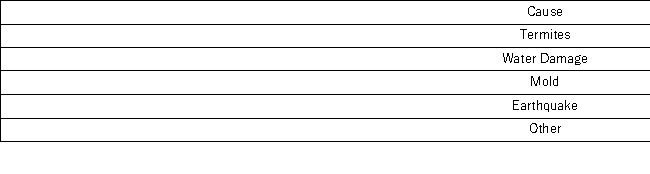 How much did the city spend to fix damage caused by mold?
A) $360,000
B) $720,000
C) $1,440,000
D) $1,800,000
Correct Answer:
Verified
Q11: When summarizing quantitative data it is always
Q13: Frequency distributions may be used to describe
Q18: A histogram is a series of rectangles
Q18: The relative frequency of a category is
Q21: A city in California spent $6 million
Q23: The accompanying chart shows the number of
Q24: An auto parts chain asked customers to
Q26: An auto parts chain asked customers to
Q27: Which of the following best describes a
Q27: The following is a list of five
Unlock this Answer For Free Now!
View this answer and more for free by performing one of the following actions

Scan the QR code to install the App and get 2 free unlocks

Unlock quizzes for free by uploading documents