The accompanying chart shows the number of books written by each author in a collection of cookbooks.What type of data is being represented? 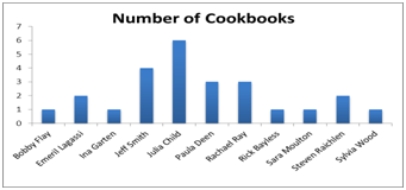
A) Quantitative,ordinal
B) Quantitative,ratio
C) Qualitative,nominal
D) Qualitative,ordinal
Correct Answer:
Verified
Q11: When summarizing quantitative data it is always
Q13: Frequency distributions may be used to describe
Q18: A histogram is a series of rectangles
Q21: A city in California spent $6 million
Q22: A city in California spent $6 million
Q24: An auto parts chain asked customers to
Q26: An auto parts chain asked customers to
Q27: Which of the following best describes a
Q27: The following is a list of five
Q28: Students in Professor Smith's business statistics course
Unlock this Answer For Free Now!
View this answer and more for free by performing one of the following actions

Scan the QR code to install the App and get 2 free unlocks

Unlock quizzes for free by uploading documents