The accompanying table shows students' scores from the final exam in a history course. 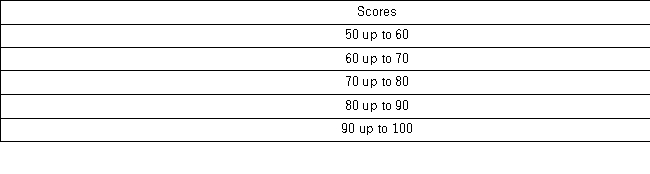 How many of the students scored at least 70 but less than 90?
A) 24
B) 31
C) 55
D) 88
Correct Answer:
Verified
Q57: The following histogram represents the number of
Q58: An analyst constructed the following frequency distribution
Q59: Consider the following frequency distribution. 
Q60: Thirty students at Eastside High School took
Q61: The accompanying relative frequency distribution represents the
Q64: Automobiles traveling on a road with a
Q65: The following table shows the number of
Q66: How does an ogive differ from a
Q66: In the accompanying stem-and-leaf diagram,the values in
Q67: In the accompanying stem-and-leaf diagram,the values in
Unlock this Answer For Free Now!
View this answer and more for free by performing one of the following actions

Scan the QR code to install the App and get 2 free unlocks

Unlock quizzes for free by uploading documents