The following table shows the number of payroll jobs the government added during the years it added jobs (since 1973) .The jobs are in thousands. 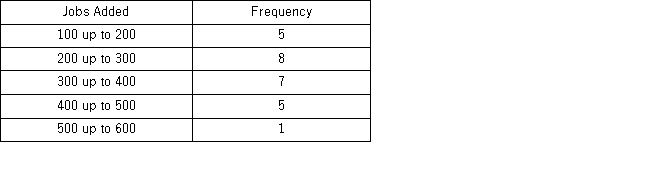 Approximately what percent of the time did the government add 200,000 or more jobs?
A) 19%
B) 50%
C) 77%
D) 81%
Correct Answer:
Verified
Q60: Thirty students at Eastside High School took
Q61: The accompanying relative frequency distribution represents the
Q62: The accompanying table shows students' scores from
Q64: Automobiles traveling on a road with a
Q66: How does an ogive differ from a
Q66: In the accompanying stem-and-leaf diagram,the values in
Q67: In the accompanying stem-and-leaf diagram,the values in
Q68: The organization of the Girl Sprouts has
Q69: The organization of the Girl Sprouts has
Q75: When displaying quantitative data, what is an
Unlock this Answer For Free Now!
View this answer and more for free by performing one of the following actions

Scan the QR code to install the App and get 2 free unlocks

Unlock quizzes for free by uploading documents