You have read about the so-called catch-up theory by economic historians,whereby nations that are further behind in per capita income grow faster subsequently.If this is true systematically,then eventually laggards will reach the leader.To put the theory to the test,you collect data on relative (to the United States)per capita income for two years,1960 and 1990,for 24 OECD countries.You think of these countries as a population you want to describe,rather than a sample from which you want to infer behavior of a larger population.The relevant data for this question is as follows: 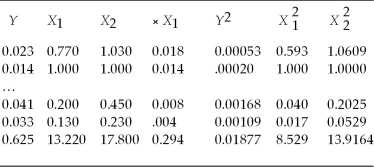 where X1 and X2 are per capita income relative to the United States in 1960 and 1990 respectively,and Y is the average annual growth rate in X over the 1960-1990 period.Numbers in the last row represent sums of the columns above.
(a)Calculate the variance and standard deviation of X1 and X2.For a catch-up effect to be present,what relationship must the two standard deviations show? Is this the case here?
(b)Calculate the correlation between Y and .What sign must the correlation coefficient have for there to be evidence of a catch-up effect? Explain.
Correct Answer:
Verified
View Answer
Unlock this answer now
Get Access to more Verified Answers free of charge
Q5: To standardize a variable you
A)subtract its mean
Q6: The cumulative probability distribution shows the probability
A)that
Q19: Assume that Y is normally distributed N(μ,σ2).Moving
Q21: The covariance inequality states that
A) 
Q22: The mean and variance of a Bernoille
Q24: To infer the political tendencies of the
Q26: Probabilities and relative frequencies are related in
Q28: Consistency for the sample average
Q31: Math and verbal SAT scores are each
Q34: Think of the situation of rolling two
Unlock this Answer For Free Now!
View this answer and more for free by performing one of the following actions

Scan the QR code to install the App and get 2 free unlocks

Unlock quizzes for free by uploading documents