Having learned in macroeconomics that consumption depends on disposable income,you want to determine whether or not disposable income helps predict future consumption.You collect data for the sample period 1962:I to 1995:IV and plot the two variables.
(a)To determine whether or not past values of personal disposable income growth rates help to predict consumption growth rates,you estimate the following relationship.  t = 1.695 + 0.126 ΔLnCt-1 + 0.153 ΔLnCt-2,
(0.484)(0.099)(0.103)
+ 0.294 ΔLnCt-3 - 0.008 ΔLnCt-4
(0.103)(0.102)
+ 0.088 ΔLnYt-1 - 0.031 ΔLnYt-2 - 0.050 ΔLnYt-3 - 0.091 ΔLnYt-4
(0.076)(0.078)(0.078)(0.074)
The Granger causality test for the exclusion on all four lags of the GDP growth rate is 0.98.Find the critical value for the 1%,the 5%,and the 10% level from the relevant table and make a decision on whether or not these additional variables Granger cause the change in the growth rate of consumption.
(b)You are somewhat surprised about the result in the previous question and wonder,how sensitive it is with regard to the lag length in the ADL(p,q)model.As a result,you calculate BIC and AIC of p and q from 0 to 6.The results are displayed in the accompanying table:
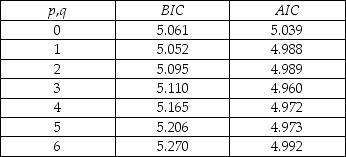 Which values for p and q should you choose?
(c)Estimating an ADL(1,1)model gives you a t-statistic of 1.28 on the coefficient of lagged disposable income growth.What does the Granger causality test suggest about the inclusion of lagged income growth as a predictor of consumption growth?
Correct Answer:
Verified
View Answer
Unlock this answer now
Get Access to more Verified Answers free of charge
Q20: The AR(p)model
A)is defined as Yt = β0
Q21: You should use the QLR test for
Q22: The Akaike Information Criterion (AIC)is given by
Q25: Problems caused by stochastic trends include all
Q26: You collect monthly data on the money
Q27: The random walk model is an example
Q28: You have collected quarterly data on Canadian
Q29: The textbook displayed the accompanying four economic
Q31: (Requires Internet Access for the test question)
The
Q34: The Augmented Dickey Fuller (ADF)t-statistic
A)has a normal
Unlock this Answer For Free Now!
View this answer and more for free by performing one of the following actions

Scan the QR code to install the App and get 2 free unlocks

Unlock quizzes for free by uploading documents