Parts manufactured by an injection molding process are subjected to a compressive strength test.We wish to monitor the compressive strength of the parts manufactured by this process using both  and s charts.Samples of size 9 are to be taken at regular intervals,and their mean compressive strength (in psi = pounds per square inch) and standard deviation are plotted on the charts in time order.The target values for the compressive strengths are a mean of = 80 psi and a standard deviation of = 3 psi.The control chart constants are (partially) reproduced below.
 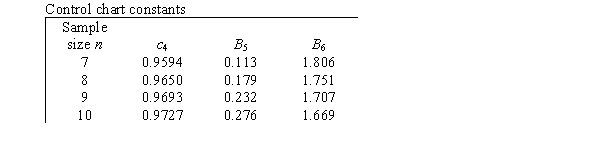 What is the upper control limit for the s chart?
A) 0.7 psi
B) 2.9 psi
C) 5.1 psi
D) 12 psi
Correct Answer:
Verified
Q1: A variable is measured periodically on a
Q2: When we examine Q3: Piston rings for an automotive engine Q5: Piston rings for an automotive engine Q6: Parts manufactured by an injection molding Q7: Piston rings for an automotive engine Q8: What is the name of a chart Q9: A statistic Q is to be used Q10: Which of the following is an example Q11: It is said that "the first step![]()
Unlock this Answer For Free Now!
View this answer and more for free by performing one of the following actions

Scan the QR code to install the App and get 2 free unlocks

Unlock quizzes for free by uploading documents