Parts manufactured by an injection molding process are subjected to a compressive strength test.We wish to monitor the compressive strength of the parts manufactured by this process using both  and s charts.Samples of size 9 are to be taken at regular intervals,and their mean compressive strength (in psi = pounds per square inch) and standard deviation are plotted on the charts in time order.The target values for the compressive strengths are a mean of = 80 psi and a standard deviation of = 3 psi.The control chart constants are (partially) reproduced below.
 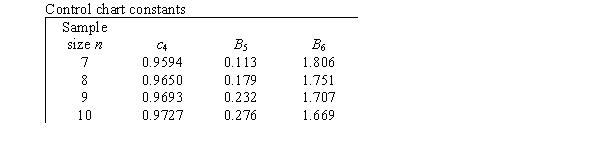 Suppose at the time of sample 10,we observe a mean of 85 psi.What should we do?
A) Declare the process out of control.
B) Continue sampling-the process is still in control.
C) Continue sampling,but increase the sample size to 16.The process is barely in control.
D) Continue sampling,but reduce the sample size to 4.The process is well in control.
Correct Answer:
Verified
Q12: What is the main function of a
Q13: Statistical stability means there is no variation
Q14: Which of the following statements about special
Q15: Which of the following is an example
Q16: You drive to school every day.This can
Q18: Piston rings for an automotive engine
Q19: Parts manufactured by an injection molding
Q20: Parts manufactured by an injection molding
Q21: Which of the following would produce an
Q22: The data below represent the means from
Unlock this Answer For Free Now!
View this answer and more for free by performing one of the following actions

Scan the QR code to install the App and get 2 free unlocks

Unlock quizzes for free by uploading documents