The data below represent the means from 15 sample control charts for the amount of time in minutes it takes students to complete a quiz in a basic statistics course.The same quiz was given to 15 different sections of a basic statistics course.Five students were sampled from each class and each mean is shown below. 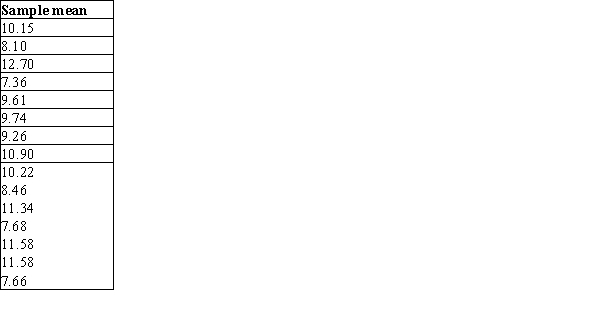 What is the value of the lower control limit?
A) 16.71
B) 2.83
C) 9.77
D) None of the above
Correct Answer:
Verified
Q17: Parts manufactured by an injection molding
Q18: Piston rings for an automotive engine
Q19: Parts manufactured by an injection molding
Q20: Parts manufactured by an injection molding
Q21: Which of the following would produce an
Q23: Which of the following is true about
Q24: The data below represent the means from
Q25: What do control limits show?
A)The exact value
Q26: You have been invited to give a
Q27: Which of the following is an example
Unlock this Answer For Free Now!
View this answer and more for free by performing one of the following actions

Scan the QR code to install the App and get 2 free unlocks

Unlock quizzes for free by uploading documents