Parts manufactured by an injection molding process are subjected to a compressive strength test.We monitor the compressive strength of the parts manufactured by this process using an  and an s control chart.Samples of size 9 are taken at regular intervals,and their mean compressive strength (in psi = pounds per square inch) and standard deviation are plotted on the charts in time order.The overall mean of the sample means is
  = 81.2 psi,and the mean of the sample standard deviations is
  = 2.9 psi.The control chart constants are (partially) reproduced below.
 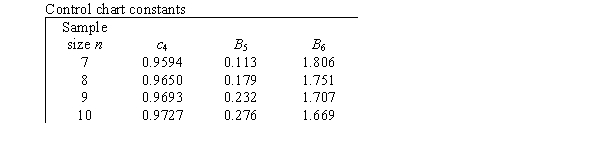 What is the lower control limit for the
  chart?
A) 0 psi
B) 18.8 psi
C) 78.2 psi
D) 78.7 psi
Correct Answer:
Verified
Q37: What do R charts measure?
A)The spread based
Q38: Which of the control charts is out
Q39: The data below represent the means from
Q40: Which of the control charts is in
Q41: When a process variable is Normally
Q43: What do we call the ability of
Q44: Suppose we use a "run of eight"
Q45: A bank is interested in improving the
Q46: Piston rings for an automotive engine are
Q47: Which of the following statements about the
Unlock this Answer For Free Now!
View this answer and more for free by performing one of the following actions

Scan the QR code to install the App and get 2 free unlocks

Unlock quizzes for free by uploading documents