Thirty students were asked,"How much time did you spend studying for the last quiz?" The histograms below were all used on the same data;however,the class size was changed for each one.Which histogram below best displays the data?
A) 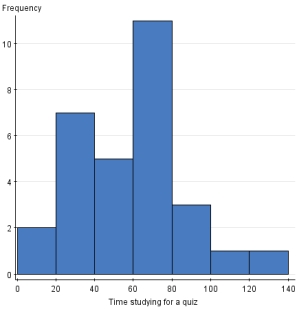
B) 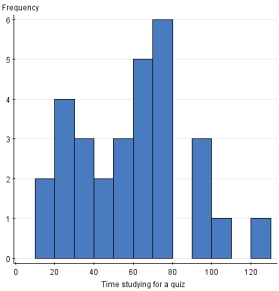
C) 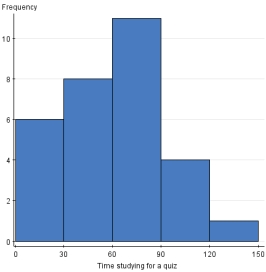
D) 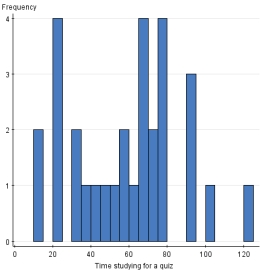
Correct Answer:
Verified
Q19: Below is a data set with information
Q20: Suppose you own a pizza delivery company
Q21: When making a stemplot,it is appropriate to
Q22: The histogram below shows data from 30
Q23: The histogram below shows data from 30
Q25: When making histograms,the classes _.
A)should be equal
Q26: Consider the following data which describe the
Q27: The stemplot below displays data from 30
Q28: When making a stemplot,it is appropriate to
Q29: The distribution of a categorical variable is
Unlock this Answer For Free Now!
View this answer and more for free by performing one of the following actions

Scan the QR code to install the App and get 2 free unlocks

Unlock quizzes for free by uploading documents