The histogram below shows data from 30 students who were asked,"How much time do you spend on the Internet in minutes?" What are some features about the data? 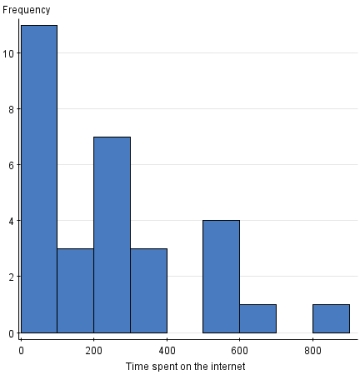
A) There is a potential outlier.
B) Most values are around 800.
C) The range of values is between 0 and 400.
D) None of the above
Correct Answer:
Verified
Q17: Below is a data set with information
Q18: Suppose you are interested in comparing the
Q19: Below is a data set with information
Q20: Suppose you own a pizza delivery company
Q21: When making a stemplot,it is appropriate to
Q23: The histogram below shows data from 30
Q24: Thirty students were asked,"How much time did
Q25: When making histograms,the classes _.
A)should be equal
Q26: Consider the following data which describe the
Q27: The stemplot below displays data from 30
Unlock this Answer For Free Now!
View this answer and more for free by performing one of the following actions

Scan the QR code to install the App and get 2 free unlocks

Unlock quizzes for free by uploading documents