The Consumers Union measured the gas mileage in miles per gallon of 38 automobiles from the 1978-1979 model-year on a special test track.The pie chart below provides information about the country of manufacture of the automobiles used in this study by the Consumers Union. 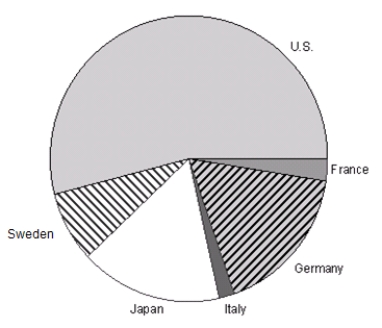 Which of the following bar graphs represents the same data as in the pie chart?
A) 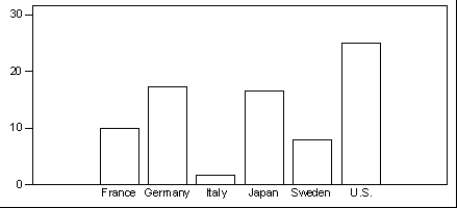
B) 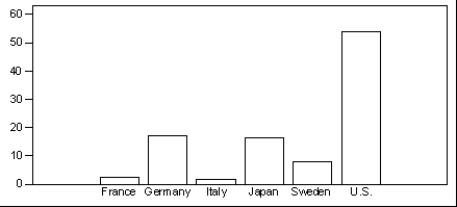
C) 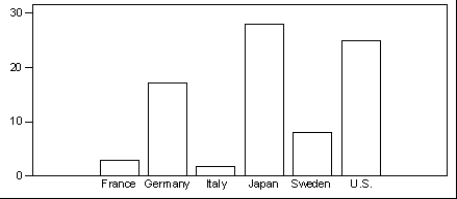
D) 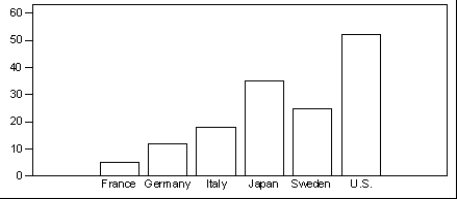
Correct Answer:
Verified
Q37: Categorical variables are best displayed by _.
A)histograms
B)pie
Q38: Consider the following data which describe the
Q39: Consider the following data which describe the
Q40: When using a pie chart,the sum of
Q41: A distributor of electronics is doing a
Q43: When using a histogram to display categorical
Q44: During the early part of the 1994
Q45: A study is being conducted on air
Q46: A sample of employees of a large
Q47: In a statistics class with 136 students,the
Unlock this Answer For Free Now!
View this answer and more for free by performing one of the following actions

Scan the QR code to install the App and get 2 free unlocks

Unlock quizzes for free by uploading documents