A study is being conducted on air quality at a small college in the South.As part of this study,monitors were posted at every entrance to this college from 6:00 a.m.to 10:00 p.m.on a randomly chosen day.The monitors recorded the mode of transportation used by each person as they entered the campus.Based on the information recorded,the following bar graph was constructed. 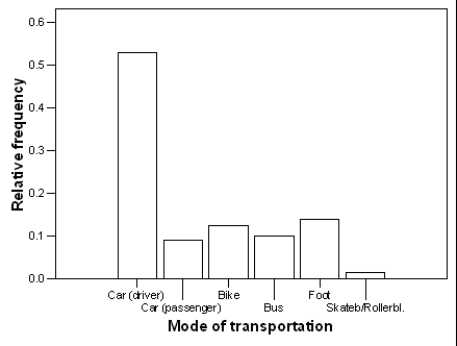 If 1200 people entered campus on this particular day, (approximately) how many people arrived by bus?
A) 10
B) 100
C) 120
D) 135
Correct Answer:
Verified
Q40: When using a pie chart,the sum of
Q41: A distributor of electronics is doing a
Q42: The Consumers Union measured the gas mileage
Q43: When using a histogram to display categorical
Q44: During the early part of the 1994
Q46: A sample of employees of a large
Q47: In a statistics class with 136 students,the
Q48: Data are collected from 1100 randomly selected
Q49: A consumer agency is testing appliances for
Q50: During the early part of the 1994
Unlock this Answer For Free Now!
View this answer and more for free by performing one of the following actions

Scan the QR code to install the App and get 2 free unlocks

Unlock quizzes for free by uploading documents