The diagram below shows the activities on the nodes, and the table shows the normal time and crash time (in days) and cost for each activity.
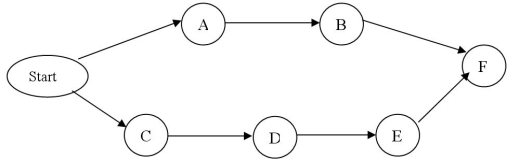
-Which activity should be crashed to reduce the project completion time by one day?
A) B
B) C
C) D
D) E
Correct Answer:
Verified
Q105: Consider the following project.
Q106: A PERT/CPM activity has an optimistic time
Q107: Which of these statements regarding project crashing
Q108: Consider the following project.
Q109: The normal cost for an activity is
Q111: A PERT/CPM activity has an optimistic time
Q112: A PERT/CPM activity has an optimistic time
Q113: Consider the following project.
Q114: Joe used a project management software package
Q115: Consider the following project.
Unlock this Answer For Free Now!
View this answer and more for free by performing one of the following actions

Scan the QR code to install the App and get 2 free unlocks

Unlock quizzes for free by uploading documents