Figure 19.1: U.S. Real Income Growth and Net Exports to China 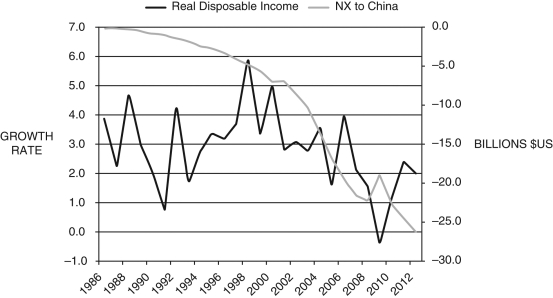
-Consider Figure 19.1, which shows growth of U.S. real disposable income (left scale) and net exports to China (right). Explain how this graph supports, or does not, studies done by economists in the 1980s and 1990s on the impacts of trade on U.S. employment.
Correct Answer:
Verified
View Answer
Unlock this answer now
Get Access to more Verified Answers free of charge
Q97: If Country A runs a trade deficit
Q98: According to economic theory, fast-growing countries should
Q99: Since the end of World War II,
Q100: There is a "magic level" where foreign
Q101: Explain how trade can be used for
Q102: Read the following passage from the New
Q103: Figure 19.3: U.S. Net Capital Outflows: 1970-2015
Q104: Figure 19.2: Foreign Assets in the U.S.
Q105: What has been the trend of trade
Q106: Figure 19.4: UK Budget Deficit (percent of
Unlock this Answer For Free Now!
View this answer and more for free by performing one of the following actions

Scan the QR code to install the App and get 2 free unlocks

Unlock quizzes for free by uploading documents