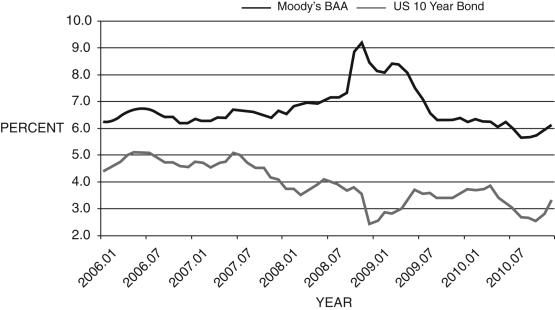
Figure 14.1: BAA and 10-Year Bonds, 2006-2010 
-In Figure 14.1 above, the financial friction in late 2008 was about ________ percent.
A) 9.5
B) 11
C) 6
D) -7
E) Not enough information is given.
Correct Answer:
Verified
Q7: Figure 14.1: BAA and 10-Year Bonds, 2006-2010
Q8: Refer to the following figure when answering
Q9: When a financial friction is added to
Q10: Which of the following represents the AD
Q11: The financial friction is the:
A) difference between
Q13: Figure 14.1: BAA and 10-Year Bonds, 2006-2010
Q14: Figure 14.1: BAA and 10-Year Bonds, 2006-2010
Q15: In response to the financial crisis, the
Q16: In response to the Great Recession, the
Q17: If ![]()
Unlock this Answer For Free Now!
View this answer and more for free by performing one of the following actions

Scan the QR code to install the App and get 2 free unlocks

Unlock quizzes for free by uploading documents