Refer to the following table to answer the following questions.
Table 7.1: U.S. Employment Status (in thousands) 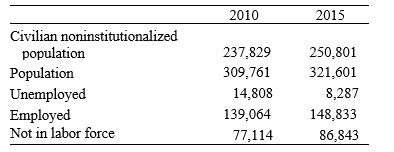
-Consider Table 7.1. Between 2010 and 2015, the employment-population ratio ________ to/at ________.
A) fell; 58.5 percent
B) rose; 90.4 percent
C) stayed more or less the same; 37.9 percent
D) fell; 5.3 percent
E) rose; 59.3 percent
Correct Answer:
Verified
Q5: Between 1960 and 2000, the:
A) employment-population ratio
Q6: Refer to the following table to answer
Q7: Refer to the following figure when answering
Q8: Over the past 50 years or so,
Q9: The labor market determines the:
A) equilibrium wage.
B)
Q11: Beginning in 2007, the _ to roughly
Q12: Refer to the following table to answer
Q13: Refer to the following table to answer
Q14: If the U.S. real output is growing,
Q15: Refer to the following figure to answer
Unlock this Answer For Free Now!
View this answer and more for free by performing one of the following actions

Scan the QR code to install the App and get 2 free unlocks

Unlock quizzes for free by uploading documents