Refer to the following figure to answer the following questions.
Figure 7.1: U.S. Unemployment Rate: 1975-2015 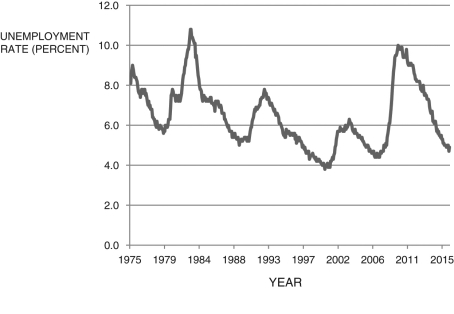 (Source: U.S. Bureau of Labor Statistics)
-Using Figure 7.1, The approximate year of the peak of the boom was:
A) 1982.
B) 1992.
C) 2005.
D) 2010.
E) 1990.
Correct Answer:
Verified
Q10: Refer to the following table to answer
Q11: Beginning in 2007, the _ to roughly
Q12: Refer to the following table to answer
Q13: Refer to the following table to answer
Q14: If the U.S. real output is growing,
Q16: Refer to the following table to answer
Q17: Refer to the following figure to answer
Q18: Refer to the following figure to answer
Q19: Over the course of his or her
Q20: The quote "It's a recession when your
Unlock this Answer For Free Now!
View this answer and more for free by performing one of the following actions

Scan the QR code to install the App and get 2 free unlocks

Unlock quizzes for free by uploading documents