Figure 7.7: Unemployment Rate 1975-2015 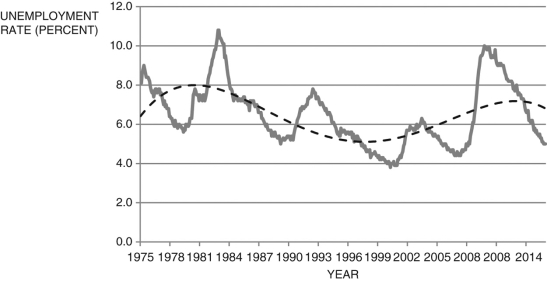
-
Consider Figure 7.7 above, which shows the unemployment rate from 1975-2015.
(a) What does the dashed line represent? How can it be represented?
(b) Based solely on this data, was the period from approximately 1996-2002 an expansion or recession? Explain. What about the period 2007-2013? 2013-2015?
(c) Based on the data presented, what is your prediction for future rates of unemployment?
Correct Answer:
Verified
View Answer
Unlock this answer now
Get Access to more Verified Answers free of charge
Q109: The idea that you value receiving $1,000
Q110: Leading up to the 2010 midterm elections,
Q111: Figure 7.6: Labor Force Participation Rate: 2000-2015
Q112: According to the text, France of income
Q113: The natural rate of unemployment is equal
Q114: The present discounted value equation 
Q115: One explanation for the college wage premium
Q116: In the "bathtub model" of unemployment, the
Q117: According to payscale.com, the average salary for
Q119: The natural rate of unemployment is equal
Unlock this Answer For Free Now!
View this answer and more for free by performing one of the following actions

Scan the QR code to install the App and get 2 free unlocks

Unlock quizzes for free by uploading documents