Consider the production function 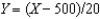
, where Y is output and X represents inputs. Graph this production function. Does it display decreasing, constant, or increasing returns to scale?
Correct Answer:
Verified
View Answer
Unlock this answer now
Get Access to more Verified Answers free of charge
Q101: In the growth accounting equation for the
Q102: In the combined Solow-Romer model, the growth
Q103: Suppose Chile and Côted'Ivoire have the same
Q104: The Romer model relies on increasing returns
Q105: In the combined Solow-Romer model, an exogenous
Q107: Consider the table below, which shows the
Q108: In growth accounting, if we subtract the
Q109: Consider the data in the following
Q110: In the Romer model, if the population
Q111: In the growth accounting equation 
Unlock this Answer For Free Now!
View this answer and more for free by performing one of the following actions

Scan the QR code to install the App and get 2 free unlocks

Unlock quizzes for free by uploading documents