Consider the table below, which shows the number of researchers in R&D (per million) in 2010 and the average growth rate of real GDP for the years 1985-2014. Explain how the Romer model explains the relationship between the number of researchers and economic growth. Given your answer, does the data below corroborate your story? How might you explain any inconsistencies between the data and the model?Table 6.2 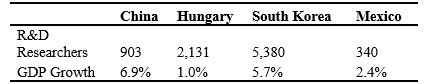
(Source: Penn World Tables 9.0 and the World Bank)
Correct Answer:
Verified
View Answer
Unlock this answer now
Get Access to more Verified Answers free of charge
Q102: In the combined Solow-Romer model, the growth
Q103: Suppose Chile and Côted'Ivoire have the same
Q104: The Romer model relies on increasing returns
Q105: In the combined Solow-Romer model, an exogenous
Q106: Consider the production function Q108: In growth accounting, if we subtract the Q109: Consider the data in the following Q110: In the Romer model, if the population Q111: In the growth accounting equation Q112: Consider the following data: ![]()

![]()
Unlock this Answer For Free Now!
View this answer and more for free by performing one of the following actions

Scan the QR code to install the App and get 2 free unlocks

Unlock quizzes for free by uploading documents