Figure 4.5: Production Function 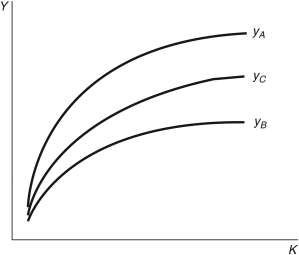
-Consider the three production functions in Figure 4.5. Each represents a different country. For any given per capita stock of physical capital, which country has the highest total factor productivity?
A) A
B) B
C) C
D) Not enough information is given.
E) They are the same.
Correct Answer:
Verified
Q84: Which of the following do(es) NOT explain
Q85: For efficient allocation of resources _ and
Q86: As a rough approximation, differences in capital
Q87: Figure 4.6: Production Function Q88: In the United States, each year of Q90: In the year 2014 the five richest Q91: The influences of institutions on economic performance Q92: Which of the following explain(s) differences in Q93: Suppose the total factor productivity in Switzerland, Q94: To decompose what explains the difference in![]()
Unlock this Answer For Free Now!
View this answer and more for free by performing one of the following actions

Scan the QR code to install the App and get 2 free unlocks

Unlock quizzes for free by uploading documents