Figure 4.6: Production Function 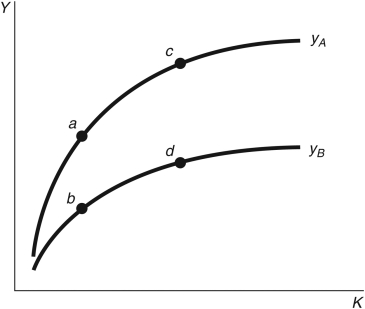
-Consider the two production functions in Figure 4.6, representing two countries. Which of the following is true?
i. At points a and b, each country has the same per capita capital stock but different factor
Productivity.
ii. Points a and c represent the same country but with different factor productivity.
iii. Points b and d represent the same country but with different stock of per capita capital.
A) i and iii
B) i only
C) ii only
D) iii only
E) i and ii
Correct Answer:
Verified
Q82: Which of the following is an example
Q83: In the year 2014 total factor productivity
Q84: Which of the following do(es) NOT explain
Q85: For efficient allocation of resources _ and
Q86: As a rough approximation, differences in capital
Q88: In the United States, each year of
Unlock this Answer For Free Now!
View this answer and more for free by performing one of the following actions

Scan the QR code to install the App and get 2 free unlocks

Unlock quizzes for free by uploading documents