Which of the following graphs best depicts the relationship between the amount of overlap between actin and myosin (y-axis) and sarcomere length (x-axis) ? 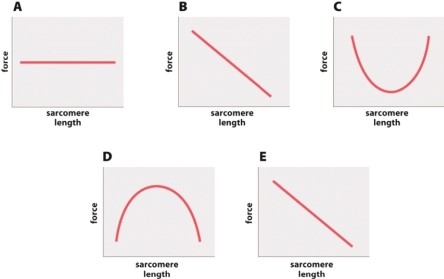
A) graph A
B) graph B
C) graph C
D) graph D
E) graph E
Correct Answer:
Verified
Q63: Maximum force is generated by a muscle
Q64: A muscle can exert force while remaining
Q65: Consider the figure below. Which of the
Q66: Rattlesnakes contract their tail shaker muscles at
Q67: What happens when action potentials stimulate a
Q69: Muscle groups that produce similar motion, or
Q70: Motion that causes two bones to move
Q71: If a muscle contracts, all of the
Q72: Why isn't there a large muscle on
Q73: The interaction of two proteins-actin and myosin-allows
Unlock this Answer For Free Now!
View this answer and more for free by performing one of the following actions

Scan the QR code to install the App and get 2 free unlocks

Unlock quizzes for free by uploading documents