It is thought that approximately 90% of plant species went extinct during the Carboniferous Period (~320-290 mya) . Which of the following graphs represent the changes that likely occurred in carbon dioxide and oxygen levels? (The solid black line depicts CO2 levels, the dashed line represents O2 levels) The left side of the x-axis represents the time of the extinction event. 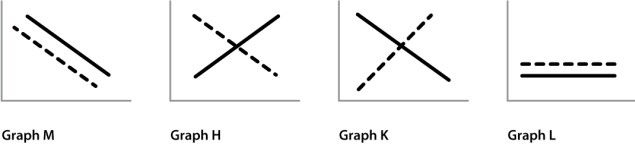
A) graph M
B) graph H
C) graph K
D) graph L
Correct Answer:
Verified
Q12: The CO2 level is _ during winter
Q13: Consider the Keeling curve, which shows a
Q14: Which of the below statements is true
Q15: Over the last several decades, what have
Q16: CO2 is added to the atmosphere by:
A)respiration.
B)photosynthesis.
C)deforestation.
D)the
Q18: The Keeling curve in Figure 25.1, below,
Q19: Why are carbon-based organic compounds, such as
Q20: The levels of CO2 in the atmosphere
Q21: The equation 6CO2 + 6H2O+ C2H12O6 +
Q22: Photosynthesis and respiration both play a major
Unlock this Answer For Free Now!
View this answer and more for free by performing one of the following actions

Scan the QR code to install the App and get 2 free unlocks

Unlock quizzes for free by uploading documents