The plots shown here depict several possible outcomes of an experiment comparing the mean phenotype of a behavioral trait in two strains of mice in three environments. Strain 1 is represented by filled circles and Strain 2 is represented by open circles. Environment 1 (E1) is deficient in stimulation for the behavior, environment 2 (E2) has an average level of stimulation, and environment 3 (E3) is enriched in stimulation. Which of the possible results indicates the presence of genotype-by-environment interaction for one or both of the strains? 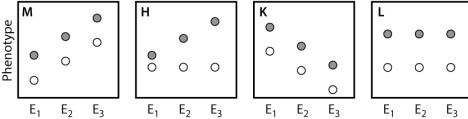
A) result M
B) result H
C) result K
D) result L
E) None of the answer options is correct.
Correct Answer:
Verified
Q1: Which of the following are complex traits
Q2: In general, the phenotypes of a complex
Q3: The graph here shows the results of
Q5: Inbred lines of animals, such as laboratory
Q6: Which of the following statements BEST reflects
Q7: If the value of the trait in
Q8: Which of the graphs below would likely
Q9: Studies have shown that 5%-10% of all
Q10: Which of the graphs below would likely
Q11: A key difference between single gene traits
Unlock this Answer For Free Now!
View this answer and more for free by performing one of the following actions

Scan the QR code to install the App and get 2 free unlocks

Unlock quizzes for free by uploading documents