Which of the curves shown here BEST represents current understanding of the rate of mutation in human sperm as the father's age increases from 20 to 40? 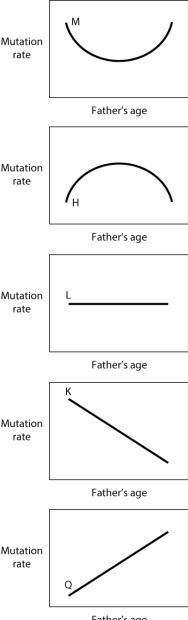
A) curve M
B) curve H
C) curve K
D) curve L
E) curve Q
Correct Answer:
Verified
Q8: According to Figure 14.2, the average number
Q9: Melanoma is cancer of the skin that
Q10: Why do mutations associated with cancer almost
Q11: In bacteria, there is a distinction between
Q12: The enzyme _ repairs breaks in the
Q14: In many organisms, mutations that replace one
Q15: It has been estimated that the average
Q16: If an organism is treated with a
Q17: In flowering plants, somatic tissue can differentiate
Q18: In the standard genetic code (Table 4.1,
Unlock this Answer For Free Now!
View this answer and more for free by performing one of the following actions

Scan the QR code to install the App and get 2 free unlocks

Unlock quizzes for free by uploading documents