A restaurant manager tracks complaints from the diner satisfaction cards that are turned in at each table.The data collected from the past week's diners have been plotted and appear in the following graph.The number of complaints for each category is with each bar. 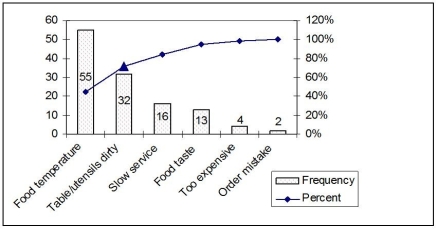 How was the value for the point represented by the triangle calculated?
A) 
B) 
C) 
D) 
Correct Answer:
Verified
Q109: A restaurant manager tracks complaints from the
Q111: A restaurant manager tracks complaints from the
Q114: A restaurant manager tracks complaints from the
Q115: The manager of a supermarket would like
Q116: The best data analysis tool for representing
Q163: A farmer that has been well-trained in
Q168: The first unit of production takes 20
Q169: The first unit of production takes 20
Q173: A manager of a fiberglass molding operation
Q215: Which of these questions is not one
Unlock this Answer For Free Now!
View this answer and more for free by performing one of the following actions

Scan the QR code to install the App and get 2 free unlocks

Unlock quizzes for free by uploading documents