A quality analyst wants to construct a sample mean chart for controlling a packaging process.He knows from past experience that the process standard deviation is two ounces.Each day last week,he randomly selected four packages and weighed each.The data from that activity appears below. 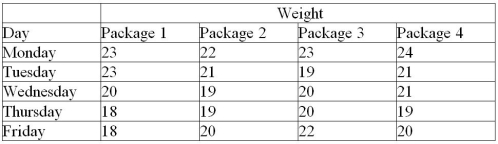 (a)Calculate all sample means and the mean of all sample means.
(b)Calculate upper and lower control limits that allow for natural variations.
(c)Is this process in control?
Correct Answer:
Verified
View Answer
Unlock this answer now
Get Access to more Verified Answers free of charge
Q67: Repeated sampling of a certain process shows
Q129: Pierre's Motorized Pirogues and Mudboats is setting
Q130: An operator trainee is attempting to monitor
Q130: Cartons of Plaster of Paris are supposed
Q132: The mean and standard deviations for a
Q133: If μ = 9 ounces, σ =
Q134: Ten samples of size four were taken
Q135: A small,independent amusement park collects data on
Q140: A woodworker is concerned about the quality
Q252: What do the terms producer's risk and
Unlock this Answer For Free Now!
View this answer and more for free by performing one of the following actions

Scan the QR code to install the App and get 2 free unlocks

Unlock quizzes for free by uploading documents