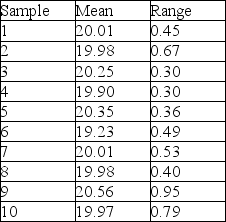
Ten samples of size four were taken from a process,and their weights measured.The sample averages and sample ranges are in the following table.Construct and plot an x-bar and R-chart using this data.Is the process in control?
Correct Answer:
Verified
View Answer
Unlock this answer now
Get Access to more Verified Answers free of charge
Q67: Repeated sampling of a certain process shows
Q70: The defect rate for a product has
Q129: Pierre's Motorized Pirogues and Mudboats is setting
Q130: An operator trainee is attempting to monitor
Q130: Cartons of Plaster of Paris are supposed
Q133: A quality analyst wants to construct a
Q133: If μ = 9 ounces, σ =
Q135: A small,independent amusement park collects data on
Q140: A woodworker is concerned about the quality
Q252: What do the terms producer's risk and
Unlock this Answer For Free Now!
View this answer and more for free by performing one of the following actions

Scan the QR code to install the App and get 2 free unlocks

Unlock quizzes for free by uploading documents