Below is a figure showing LTP that was induced by high frequency stimulation (indicated by the arrow) at 0 minutes (traces 1 - 3). 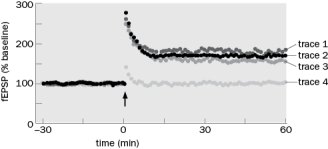 Figure Q10-11
A. What would happen to LTP if the NMDARs were blocked with APV? Which trace would be generated?
B. What would happen if an NMDAR with a higher ion channel conductance than normal was expressed in the postsynaptic cell? Which resulting trace would be generated?
Correct Answer:
Verified
View Answer
Unlock this answer now
Get Access to more Verified Answers free of charge
Q12: Figure Q10-15 illustrates the data from one
Q13: What are 'silent synapses'? Select all that
Q14: Why does the NMDAR provide a good
Q15: How is LTD generated? Choose all that
Q16: In an experiment that showed that CaMKII
Q18: In the sentence below, circle the correct
Q19: Which is an example of cooperativity? Select
Q20: Why was the postsynaptic CA1 neuron voltage
Q21: For the graph on the right, the
Q22: Taking together the results in Figure Q10-37,
Unlock this Answer For Free Now!
View this answer and more for free by performing one of the following actions

Scan the QR code to install the App and get 2 free unlocks

Unlock quizzes for free by uploading documents