The following figure shows the domestic demand and supply curves for a good. With free trade, the price of the good in the domestic market is P3. The government introduces a 5% tariff in the market which raises the domestic price to P2.
Figure 7-1
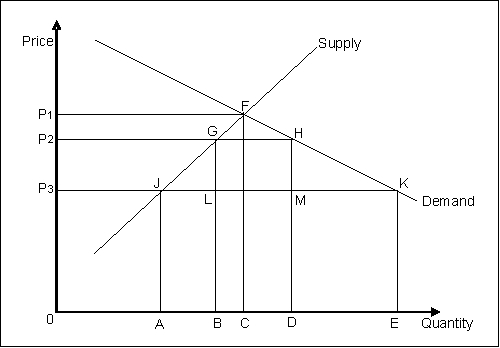
-Refer to Figure 7-1. With the imposition of the tariff, the change in producer surplus is equal to:
A) a loss measured by the area of P1FGP2.
B) a gain measured by the area of P1FJP3.
C) a gain measured by the area of P2GJP3.
D) a loss measured by the area of P3JA0.
E) a gain measured by the area of P1FC0.
Correct Answer:
Verified
Q23: Provide two examples of events that can
Q24: The following figure shows the domestic demand
Q25: Provide two examples of events that can
Q26: In a given market, demand is described
Q27: The marginal cost of a firm under
Q29: The following figure shows the domestic demand
Q30: With free trade, the market for a
Q31: The following figure shows the domestic demand
Q32: When all trade is prohibited in good
Q33: Derive the long-run supply curve of a
Unlock this Answer For Free Now!
View this answer and more for free by performing one of the following actions

Scan the QR code to install the App and get 2 free unlocks

Unlock quizzes for free by uploading documents