The following figure shows the domestic demand and supply curves for a good. With free trade, the price of the good in the domestic market is P3. The government introduces a 5% tariff in the market which raises the domestic price to P2.
Figure 7-1
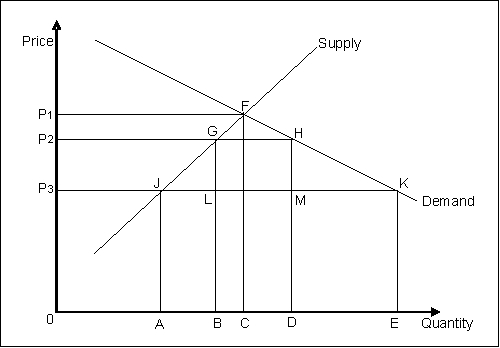
-Refer to Figure 7-1. The increase in the government's revenue due to the imposition of a tariff is equal to:
A) the area of GFHML.
B) the area of GHKJ.
C) the area of P1FKP3.
D) the area of GHML.
E) the area of P2HKP3.
Correct Answer:
Verified
Q19: If the price of a good increases
Q20: The demand curve faced by an individual
Q21: Explain why the demand curve for a
Q22: Explain why perfectly competitive firms cannot earn
Q23: Provide two examples of events that can
Q25: Provide two examples of events that can
Q26: In a given market, demand is described
Q27: The marginal cost of a firm under
Q28: The following figure shows the domestic demand
Q29: The following figure shows the domestic demand
Unlock this Answer For Free Now!
View this answer and more for free by performing one of the following actions

Scan the QR code to install the App and get 2 free unlocks

Unlock quizzes for free by uploading documents