The time series line chart below shows the prices of a volatile stock from January 1999 to December 1999. Between which two consecutive months did the price of the stock drop by The greatest percentage? 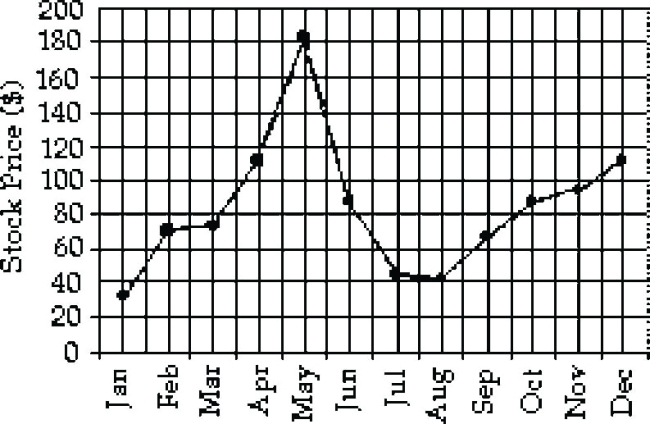
A) June - July
B) August - September
C) May - June
D) None of the above
Correct Answer:
Verified
Q21: The stem-and-leaf diagram below shows the
Q22: A machine is supposed to fill
Q23: Using the graphical display below. Q24: Which line chart below represents the Q25: The data below represent the results Q27: The table shows the end-of-the-month checking Q28: Over the past 4 years of Q29: Using the graphical display below. Q30: A car dealer is deciding what Q31: States with high deer populations have![]()
![]()
Unlock this Answer For Free Now!
View this answer and more for free by performing one of the following actions

Scan the QR code to install the App and get 2 free unlocks

Unlock quizzes for free by uploading documents