The data below represent the results of a poll in which the following question was asked: "To what degree are you satisfied with your current health insurance?" Which pie chart below
Represents the given data set?
A) 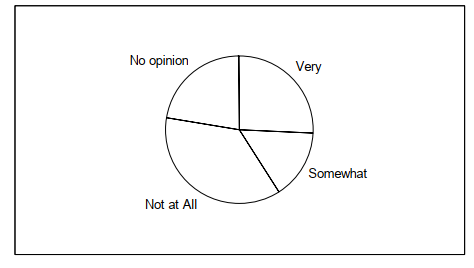
B) 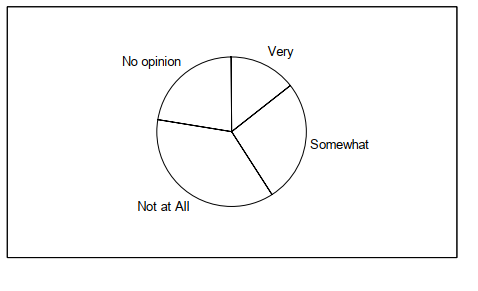
Correct Answer:
Verified
Q20: A nurse measured the blood pressure of
Q21: The stem-and-leaf diagram below shows the
Q22: A machine is supposed to fill
Q23: Using the graphical display below. Q24: Which line chart below represents the Q26: The time series line chart below shows Q27: The table shows the end-of-the-month checking Q28: Over the past 4 years of Q29: Using the graphical display below. Q30: A car dealer is deciding what![]()
![]()
Unlock this Answer For Free Now!
View this answer and more for free by performing one of the following actions

Scan the QR code to install the App and get 2 free unlocks

Unlock quizzes for free by uploading documents