Using the graphical display below.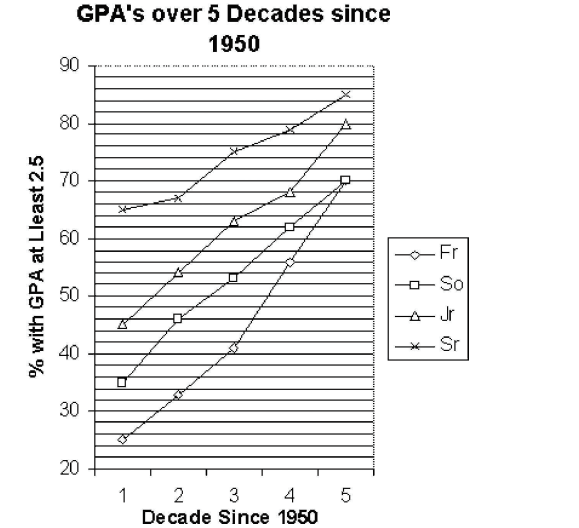
-Identify the class that had the lowest percentage increase in 2.5 or better GPA's between the fourth and fifth decades.
A) Sr
B) Jr
C) So
D) Fr
Correct Answer:
Verified
Q18: The Kappa Iota Sigma Fraternity polled its
Q19: Construct a bar chart for the
Q20: A nurse measured the blood pressure of
Q21: The stem-and-leaf diagram below shows the
Q22: A machine is supposed to fill
Q24: Which line chart below represents the
Q25: The data below represent the results
Q26: The time series line chart below shows
Q27: The table shows the end-of-the-month checking
Q28: Over the past 4 years of
Unlock this Answer For Free Now!
View this answer and more for free by performing one of the following actions

Scan the QR code to install the App and get 2 free unlocks

Unlock quizzes for free by uploading documents