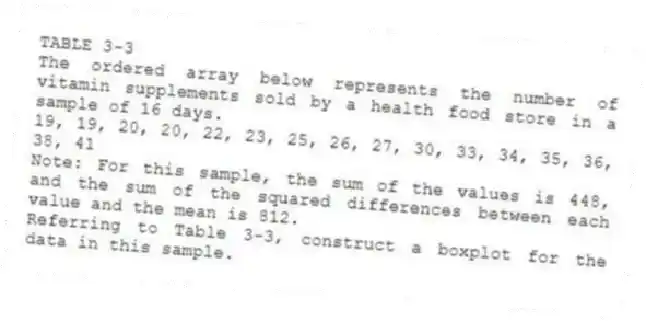
TABLE 3-3
The ordered array below represents the number of vitamin supplements sold by a health food store in a sample of 16 days.
19, 19, 20, 20, 22, 23, 25, 26, 27, 30, 33, 34, 35, 36, 38, 41
Note: For this sample, the sum of the values is 448, and the sum of the squared differences between each value and the mean is 812.
-Referring to Table 3-3, construct a boxplot for the data in this sample.
Correct Answer:
Verified
Q86: TABLE 3-3
The ordered array below represents the
Q87: TABLE 3-4
The ordered array below represents the
Q88: TABLE 3-3
The ordered array below represents the
Q89: TABLE 3-4
The ordered array below represents the
Q90: TABLE 3-4
The ordered array below represents the
Q92: TABLE 3-4
The ordered array below represents the
Q93: TABLE 3-3
The ordered array below represents the
Q94: TABLE 3-3
The ordered array below represents the
Q95: TABLE 3-5
The rates of return of a
Q96: TABLE 3-4
The ordered array below represents the
Unlock this Answer For Free Now!
View this answer and more for free by performing one of the following actions

Scan the QR code to install the App and get 2 free unlocks

Unlock quizzes for free by uploading documents