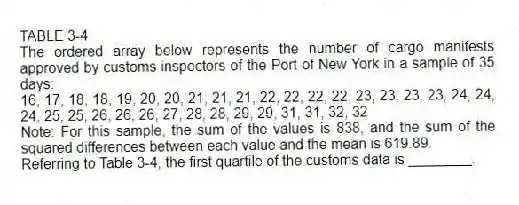
TABLE 3-4
The ordered array below represents the number of cargo manifests approved by customs inspectors of the Port of New York in a sample of 35 days:
16, 17, 18, 18, 19, 20, 20, 21, 21, 21, 22, 22, 22, 22, 23, 23, 23, 23, 24, 24, 24, 25, 25, 26, 26, 26, 27, 28, 28, 29, 29, 31, 31, 32, 32
Note: For this sample, the sum of the values is 838, and the sum of the squared differences between each value and the mean is 619.89.
-Referring to Table 3-4, the first quartile of the customs data is ________.
Correct Answer:
Verified
Q84: TABLE 3-4
The ordered array below represents the
Q85: TABLE 3-4
The ordered array below represents the
Q86: TABLE 3-3
The ordered array below represents the
Q87: TABLE 3-4
The ordered array below represents the
Q88: TABLE 3-3
The ordered array below represents the
Q90: TABLE 3-4
The ordered array below represents the
Q91: TABLE 3-3
The ordered array below represents the
Q92: TABLE 3-4
The ordered array below represents the
Q93: TABLE 3-3
The ordered array below represents the
Q94: TABLE 3-3
The ordered array below represents the
Unlock this Answer For Free Now!
View this answer and more for free by performing one of the following actions

Scan the QR code to install the App and get 2 free unlocks

Unlock quizzes for free by uploading documents