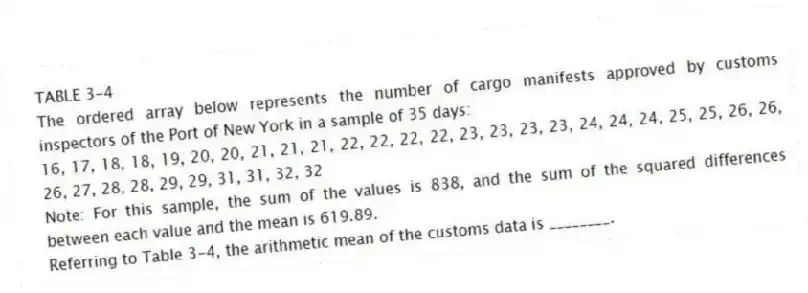
TABLE 3-4
The ordered array below represents the number of cargo manifests approved by customs inspectors of the Port of New York in a sample of 35 days:
16, 17, 18, 18, 19, 20, 20, 21, 21, 21, 22, 22, 22, 22, 23, 23, 23, 23, 24, 24, 24, 25, 25, 26, 26, 26, 27, 28, 28, 29, 29, 31, 31, 32, 32
Note: For this sample, the sum of the values is 838, and the sum of the squared differences between each value and the mean is 619.89.
-Referring to Table 3-4, the arithmetic mean of the customs data is ________.
Correct Answer:
Verified
Q85: TABLE 3-4
The ordered array below represents the
Q86: TABLE 3-3
The ordered array below represents the
Q87: TABLE 3-4
The ordered array below represents the
Q88: TABLE 3-3
The ordered array below represents the
Q89: TABLE 3-4
The ordered array below represents the
Q91: TABLE 3-3
The ordered array below represents the
Q92: TABLE 3-4
The ordered array below represents the
Q93: TABLE 3-3
The ordered array below represents the
Q94: TABLE 3-3
The ordered array below represents the
Q95: TABLE 3-5
The rates of return of a
Unlock this Answer For Free Now!
View this answer and more for free by performing one of the following actions

Scan the QR code to install the App and get 2 free unlocks

Unlock quizzes for free by uploading documents