The broken-line graph shows the percent of adults in the United States over 18 years old who took the influenza vaccine during recent years. Use the graph Between what two consecutive years was there a decrease in the percent of U.S. adults aged 18 and older taking the influenza vaccine? 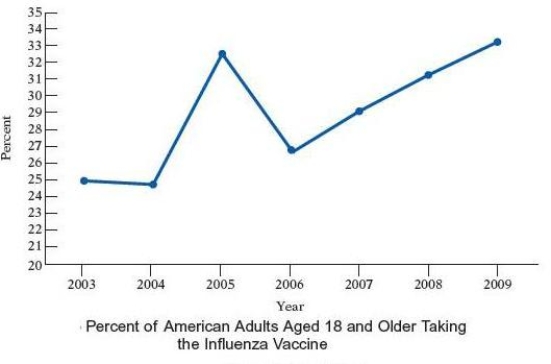
A) 2006 and 2007
B) 2005 and 2006
C) 2004 and 2005
D) 2004 and 2006
E) 2005 and 2007
Correct Answer:
Verified
Q31: A nurse monitors the blood glucose levels
Q32: The double-broken-line graph below shows the number
Q33: The broken-line graph shows the percent
Q34: The broken-line graph below shows the average
Q35: A nurse monitors the blood glucose levels
Q37: The double-broken-line graph shows the number of
Q38: The bar graph shows the increasing life
Q39: The bar graph shows the increasing life
Q40: The bar graph shows the increasing life
Q41: Most health statistics list normal body
Unlock this Answer For Free Now!
View this answer and more for free by performing one of the following actions

Scan the QR code to install the App and get 2 free unlocks

Unlock quizzes for free by uploading documents