The double-broken-line graph shows the number of Calories per day that should be consumed by women and men in various age groups. Use the following graph. People of what age and gender have the lowest recommended number of Calories? 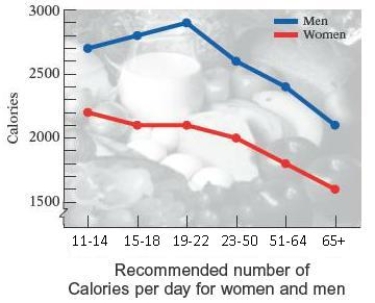
A) 70+ women
B) 75+ women
C) 60+ women
D) 65+ women
E) 80+ women
Correct Answer:
Verified
Q32: The double-broken-line graph below shows the number
Q33: The broken-line graph shows the percent
Q34: The broken-line graph below shows the average
Q35: A nurse monitors the blood glucose levels
Q36: The broken-line graph shows the percent of
Q38: The bar graph shows the increasing life
Q39: The bar graph shows the increasing life
Q40: The bar graph shows the increasing life
Q41: Most health statistics list normal body
Q42: The total cholesterol readings for 40 female
Unlock this Answer For Free Now!
View this answer and more for free by performing one of the following actions

Scan the QR code to install the App and get 2 free unlocks

Unlock quizzes for free by uploading documents