The total cholesterol readings for 40 female patients seen this week at a doctor's office were recorded. Figure is a histogram of these data. Use the following figure. How many patients had total cholesterol readings between 500 and 600? 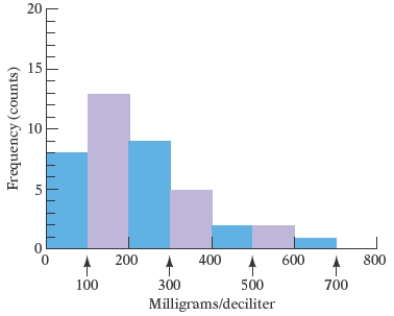
A) 4 patients
B) 3 patients
C) 2 patients
D) 5 patients
E) 6 patients
Correct Answer:
Verified
Q37: The double-broken-line graph shows the number of
Q38: The bar graph shows the increasing life
Q39: The bar graph shows the increasing life
Q40: The bar graph shows the increasing life
Q41: Most health statistics list normal body
Q43: The frequency polygon Figure shows the approximate
Q44: The heights, in inches, of the women
Q45: Most health statistics list normal body temperature
Q46: The resting heart rates for a group
Q47: The frequency polygon in the below
Unlock this Answer For Free Now!
View this answer and more for free by performing one of the following actions

Scan the QR code to install the App and get 2 free unlocks

Unlock quizzes for free by uploading documents