Table 12-2
The following represents a project with four activities. All times are in weeks. 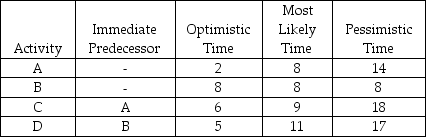
-According to the data in Table 12-2, what is the minimum expected completion time for the project?
A) 18
B) 19
C) 37
D) 11
E) None of the above
Correct Answer:
Verified
Q17: Given the assumptions in PERT, the probability
Q41: Given an activity's optimistic,most likely,and pessimistic time
Q41: Table 12-1
The following represents a project with
Q42: Table 12-1
The following represents a project with
Q46: Table 12-2
The following represents a project with
Q47: Given the following small project, the critical
Q48: Table 12-1
The following represents a project with
Q50: Given an activity's optimistic,most likely,and pessimistic time
Q51: Given an activity's optimistic,most likely,and pessimistic time
Q57: Given an activity's optimistic,most likely,and pessimistic time
Unlock this Answer For Free Now!
View this answer and more for free by performing one of the following actions

Scan the QR code to install the App and get 2 free unlocks

Unlock quizzes for free by uploading documents